Decades later, people still argue over Reagan's economic policies, known as "Reaganomics." Did lowering tax rates really cause federal tax revenue to climb? Or did Ronald Reagan sell the public an economic fairy tale? To answer that, we have to look at the history of the Laffer Curve, the economist behind it, and what real data says about the peak tax rate.
The Napkin That Changed American Politics
The Laffer Curve is named after Arthur Laffer, an economist who served as a professor and economic adviser in Washington during the 1970s. Laffer was known for his sharp mind, energetic personality, and strong belief in "supply-side economics"—the idea that economic growth depends mostly on incentives to produce, work, and invest.
The story of the curve began in December 1974 at the Two Continents Restaurant in Washington, D.C. Arthur Laffer sat down for dinner with two high-ranking political aides: Dick Cheney, who was the White House deputy chief of staff, and Donald Rumsfeld, the chief of staff under President Gerald Ford. Jude Wanniski, an associate editor for The Wall Street Journal, was also at the table.
President Ford wanted to raise taxes to fight inflation. Laffer strongly disagreed. To prove his point, Laffer grabbed a cloth napkin and a pen. He drew a simple curved line that looked like an upside-down letter "U."
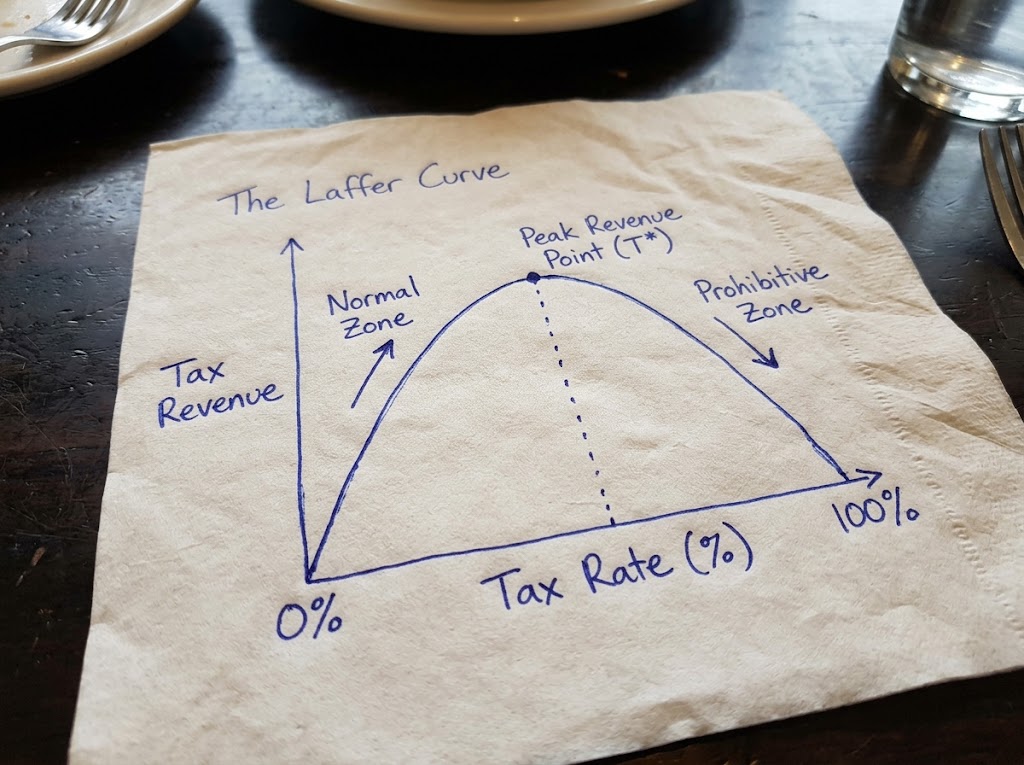
Laffer explained that the horizontal axis showed the tax rate, from 0% to 100%. The vertical axis showed the total amount of money the government collected.
He pointed out two extreme situations:
1. At a 0% tax rate: The government takes no money from workers or businesses. Therefore, total tax revenue is zero dollars.
2. At a 100% tax rate: The government takes every single dollar a person earns. Why would anyone go to work, build a factory, or run a business if the government takes every penny? People would stop working or hide their money under the table. Therefore, at 100%, total tax revenue also drops to zero.
Because revenue is zero at both 0% and 100%, the line connecting them cannot just go straight up. It has to bend. Somewhere between 0% and 100%, there is a sweet spot—a "peak tax rate"—where the government collects the absolute maximum amount of money possible.
Arthur Laffer never claimed he invented this concept. In fact, he gave credit to older thinkers. Centuries earlier, the 14th-century Muslim scholar Ibn Khaldun wrote in his book, The Muqaddimah, that empires collect plenty of revenue when taxes are low because commerce thrives, but collect very little when taxes grow too heavy. In the 18th century, Adam Smith wrote similar ideas in The Wealth of Nations, and John Maynard Keynes noted that high tax rates can destroy the tax base.
Yet because Laffer drew the diagram on that dinner napkin and promoted it to political leaders, the concept forever carried his name.
Supply-Side Economics and the Big Promise
Before the 1980 election, the top federal income tax rate in the United States was 70%. That meant that for every dollar earned over a certain threshold, the top earner gave 70 cents directly to the federal government.
Ronald Reagan, who had been a high-paid Hollywood actor in the 1940s, remembered how high taxes affected his own work habits. Under World War II tax rules, the top tax rate had reached 91% to 94%. Reagan often recounted that once an actor finished four pictures in a year and entered the 90% tax bracket, they simply stopped working for the rest of the year. Why make a fifth movie when you only keep nine cents on the dollar?
Laffer and his fellow supply-side economists argued that the United States in 1980 had drifted into what they called the "prohibitive zone"—the right-hand side of the peak. In this zone, taxes are so high that they crush ambition, encourage tax evasion, and choke off business investment.
Reagan took this argument to voters. He claimed that if the government lowered tax rates, people would work more hours, start new companies, and take bigger business risks. Even though the government would take a smaller percentage slice of each paycheck, the entire economic "pie" would grow so large that the total dollar amount of tax revenue would increase.
When Reagan won the presidency, he quickly pushed through the Economic Recovery Tax Act of 1981. This law slashed the top individual income tax rate from 70% to 50% across three years. Later, through the Tax Reform Act of 1986, the top rate dropped all the way to 28%.
Where Is the Peak? What the Research Says
The logic behind the Laffer Curve is undisputed: 0% yields zero revenue, and 100% destroys production. But the central debate has always been: Where is the peak?
If the peak is at 40%, and current taxes are at 70%, cutting taxes will indeed increase revenue. But if the peak is at 70%, and current taxes are at 40%, cutting taxes will cause government revenue to fall sharply.
To find the true peak, economists study how people alter their behavior when tax rates change. Economists call this the "elasticity of taxable income." When taxes drop, do people actually work twice as hard, or do they just keep working the same hours and enjoy paying less tax?
Modern peer-reviewed economic studies have calculated where the peak of the Laffer Curve actually sits:
- Emmanuel Saez, Joël Slemrod, and Seth Giertz (2012): In a comprehensive review published in the Journal of Economic Literature, these economists examined decades of tax data. They found that most ordinary wage earners do not change their work hours significantly when tax rates shift. High-income earners change how they report their income, but primarily through legal accounting tricks and deductions rather than working harder. They estimated that the revenue-maximizing top tax rate for the United States sits around 65% to 75%.
- Mathias Trabandt and Harald Uhlig (2011): In a study for the National Bureau of Economic Research (NBER), these economists modeled the economies of the United States and the European Union. They calculated that the peak of the US capital tax curve was around 63%, and the labor tax peak was roughly 65%. They concluded that the United States was firmly on the left side of the curve, meaning that broad tax cuts always led to lower total revenues.
- Christina Romer and David Romer (2010): Former White House economic advisers Christina and David Romer tracked tax policy changes since World War II in the American Economic Review. While they found that tax cuts provide a meaningful short-term boost to GDP growth, they showed that the resulting economic growth is never large enough to fully pay for the lost revenue.
Every major empirical study reached the same conclusion: in 1981, the United States was not on the right side of the peak. Taxes were high, but they were not high enough to make a tax cut pay for itself.
Did Reagan Lie, or Was He Mistaken?
To judge whether Ronald Reagan lied, we have to separate his public claims from what actually happened to government revenues in the 1980s.
First, look at the raw numbers. In 1980, federal tax revenues were roughly $517 billion. By 1989, when Reagan left office, federal revenues had grown to $991 billion. On the surface, this looks like proof that Reagan was right: taxes were cut, and revenues went up!
However, economists point out two critical factors that explain why revenues rose:
1. Inflation: High inflation during the early 1980s meant that prices and wages automatically rose in dollar terms, even if people were not actually richer.
2. Population Growth: The American population expanded by over 20 million people in the 1980s. More workers paying taxes naturally means more total dollars collected.
When economists adjust for inflation and population growth, or look at federal tax revenue as a share of the overall economy (Gross Domestic Product, or GDP), a very different picture emerges:
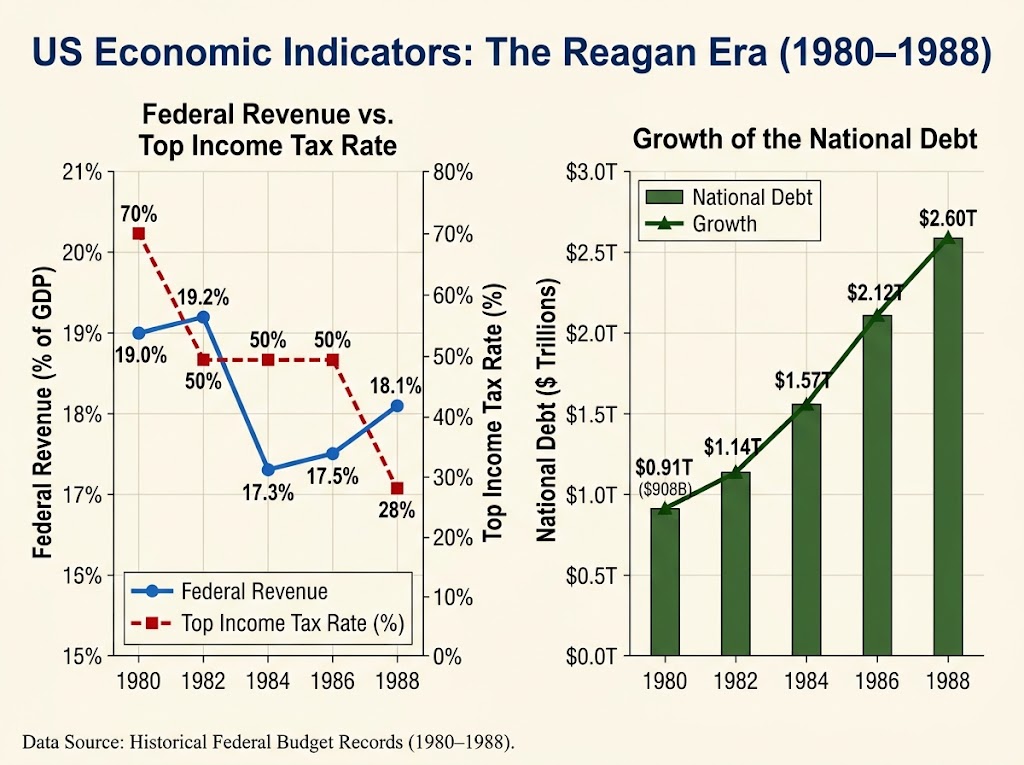
Federal tax revenue as a share of the economy actually declined following the 1981 tax cuts. Furthermore, because government spending continued to climb while revenues dipped, the federal budget deficit surged. During Reagan's eight years in office, the national debt nearly tripled, jumping from roughly $900 billion to $2.6 trillion.
Even members of Reagan's own administration admitted the math did not work. David Stockman, Reagan's Director of the Office of Management and Budget, later confessed in interviews and in his 1986 memoir that supply-side claims were a political strategy rather than hard mathematics. Stockman acknowledged that the administration knew the tax cuts would create massive deficits unless domestic spending was dismantled.
Calling it a direct "lie" may be too simple. Ronald Reagan was an ideological believer. He genuinely believed his own Hollywood experience applied to the entire national economy. He believed that lowering taxes was a moral duty that would liberate the spirit of American enterprise. But based on the mathematical evidence, the central economic claim he presented to the American public—that cutting income tax rates would pay for itself—was objectively false.
Concrete Takeaways for Economic Policy
The story of Ronald Reagan and the Laffer Curve offers practical lessons for modern debates on tax policy:
1. Verify Baseline Positions First: Before proposing any tax cut with the promise that it will "pay for itself," lawmakers must calculate whether current rates are actually past the peak rate (65%–75%). When tax rates are already moderate, tax cuts will reduce revenue and expand budget deficits.
2. Account for Static vs. Dynamic Effects: Economic growth from tax cuts offsets only a small fraction (roughly 10% to 30%) of lost tax revenue. Budget projections must realistically account for net revenue losses.
3. Target Tax Base Broadening: Simplifying the tax code by eliminating deductions, loopholes, and shelters produces far more consistent economic efficiency than simply cutting headline top rates.
Bibliography
Khaldun, I. (1377). The Muqaddimah: An Introduction to History (F. Rosenthal, Trans.). Princeton University Press (Reprinted 1958).
Laffer, A. B. (2004). The Laffer Curve: Past, Present, and Future. The Heritage Foundation Backgrounder, No. 1765. https://www.heritage.org/taxes/report/the-laffer-curve-past-present-and-future
Romer, C. D., & Romer, D. H. (2010). The Macroeconomic Effects of Tax Changes: Estimates Based on a New Measure of Fiscal Shocks. American Economic Review, 100(3), 763–801. https://doi.org/10.1257/aer.100.3.763
Saez, E., Slemrod, J., & Giertz, S. H. (2012). The Elasticity of Taxable Income with Respect to Marginal Tax Rates: A Critical Review. Journal of Economic Literature, 50(1), 3–50. https://doi.org/10.1257/jel.50.1.3
Smith, A. (1776). An Inquiry into the Nature and Causes of the Wealth of Nations. W. Strahan and T. Cadell.
Stockman, D. A. (1986). The Triumph of Politics: Why the Reagan Revolution Failed. Harper & Row.
Trabandt, M., & Uhlig, H. (2011). The How and Why of the Laffer Curve: A Quantitative Evaluation. Journal of Public Economics, 95(9–10), 1127–1142. https://doi.org/10.1016/j.jpubeco.2011.04.004
Wanniski, J. (1978). The Way the World Works: How Economies Fail—and Succeed. Basic Books.


Comments
You cite a few studies that show the peak of the curve near 75%, but you ignore other studies that show it's lower. For instance, Rachel Moore, Brandon Pecoraro, and David Splinter suggest that the Laffer curve is pretty flat, and that the peak is at or below about 50%.
That's a good point. It might be fun to do a meta analysis.