The Laffer Curve is Misunderstood

The Laffer curve (named for economist Arthur Laffer who presented it to members of the Ford Administration in the 1970s) explains a very simple concept. And, that concept has been the foundation of a lot of economic policy ever since.
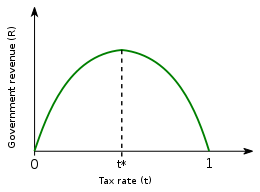
The idea is that there are two income tax rates for which the government will receive zero revenue. If you tax at 0%, then nobody is paying anything so the government gets nothing. If you tax a 100%, then there is no benefit to working, so nobody works and the government gets nothing. Somewhere, between 0% and 100% is the tax rate (“t*” in the attached image that I stole from Wikipedia, but what I like to call the “Max Tax Rate”.) where the government gets the most revenue. Like I said, it’s pretty simple.
If you tax above the mythical Max Tax Rate, then lowering taxes will both allow people to keep more of the money they make and increase tax revenues. This works because there is more incentive to participate in the economy, so the economy does better.
It’s become an article of faith in the Republican Party that this means reducing taxes will improve the economy and increase revenues. Let’s see if the Republican’s are correct.
To test the Republican hypothesis, we need to know both the current income tax rate and the value of Max Tax Rate. Neither of these is simple to calculate.
The problem with calculating the tax rate is that the United States is that it’s complicated. When we think of taxation, we immediately think of our Federal income tax and, maybe, state income tax. But we don’t tend to include property taxes, sales taxes and other taxes into the mix. Not all of the taxes are based on income.
My best guess is that the average family in the middle 20% of income earners earned $51,666 and paid $15,748 in taxes. That’s about a 30.5% tax rate.
One might reasonably argue that the higher earners have a disproportionate effect on tax revenues. In the case of the top 20% of income earners, the average family earned $332,200 and paid about $107,000 in total taxes. That’s about a 32.2% tax rate, which isn’t substantially different from the middle quintile.
Calculating the Max Tax Rate is insidiously hard. It’s largely a function of psychology, which means it probably moves as consumer sentiment changes. (During COVID, it’s my guess that it dropped quite a bit, but has largely recovered since then.) It’s also true that Federal Income Tax is but one part of the taxes we pay. But the good news is that some very smart people have done a lot of detailed analysis. Let’s look at it.
- In 1995, economist Paul Pecorino presented a model that predicted the Max Tax Rate in the U.S. be at around 65%.
- A draft paper by Y. Hsing observed the U.S. economy between 1959 and 1992 and estimated that the revenue-maximizing average federal tax rate would be between 32.67% and 35.21%. (It is worth noting that this paper only considers the federal tax rate.)
- In 1981, the Journal of Political Economy presented a model based on empirical data that indicated that the Max Tax Rate for Sweden was about 70%.
- A 2011 study by Trabandt and Uhlig, published in the Journal of Monetary Economics estimated a Max Tax Rate of about 70%.
- In 2005, the Congressional Budget Office estimated that a reduction in the marginal federal income tax rate from 25% to 22.5% would be revenue negative.
- In 2013, the United Kingdom reduced its top income tax rate from 50% to 45%. Of the £90-billion of income taxable at that level, the end result was estimated to be a revenue loss of about £100-million. This would indicate that the United Kingdom was operating rather close to the Max Tax Rate.
While there are a wide range of credible estimates for where the Max Tax Rate is, all of them put it above the 32.2% tax rate enjoyed by the average family in the top quintile. In short, when someone proposes that a tax cut in the U.S. will increase tax revenues and reduce the size of the deficit, they are wrong.